|
Below Find the January 2020 Market Update by County for the Triangle. To see market stats for communities in the Triangle, mouse over communities on this website and click on the community you would like market stats on and scroll to the bottom of the page. This resource is current to the date you pull data. Just another resource we offer to assist you with increasing your knowledge base about Real Estate. In Chatham County, there was a 6.4 percent decrease in the number of new listings in January which decreased from 109 to 102. The number of closed sales increased from 84 to 94, a 11.9 percent increase. Median sales prices also increased by 10.9 percent. In January, Chatham County median sales price exceeded the median sales price for all MLS listings. 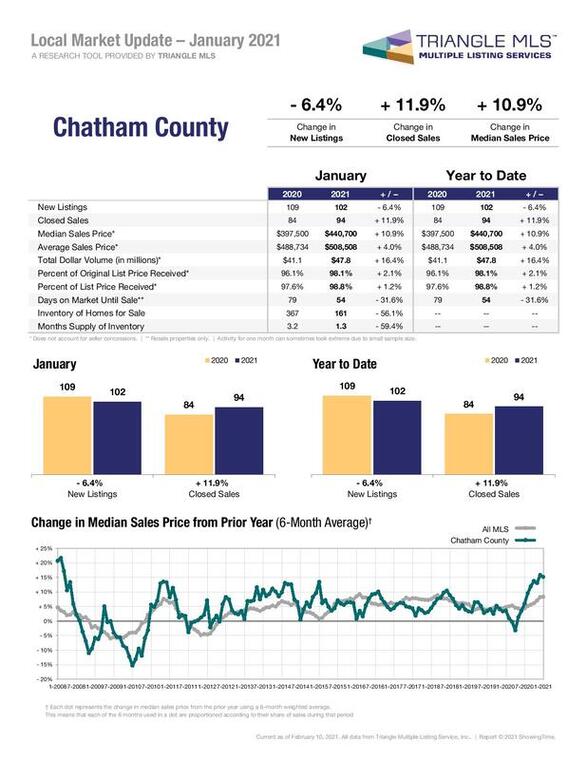 In Durham County, new listings decreased by 15.9 percent and closed sales have decreased by 14.9 percent. Median sales price has increased 4.5 percent from this time, moving from $280,000 to $292,600. Average sales price increased by 7.5 percent. In January, the Durham County median sales price was approximately level with the median sales price of all MLS listings.  The number of listings in Orange County has increased by 8.2 percent, from 147 to 159 new listings this year. There was a 48.2 percent increase in closed sales. Additionally, median sales price increased by 8 percent, from $314,000 to $339,000. In January, Orange County median sales price exceeded the median sales price for all MLS listings. 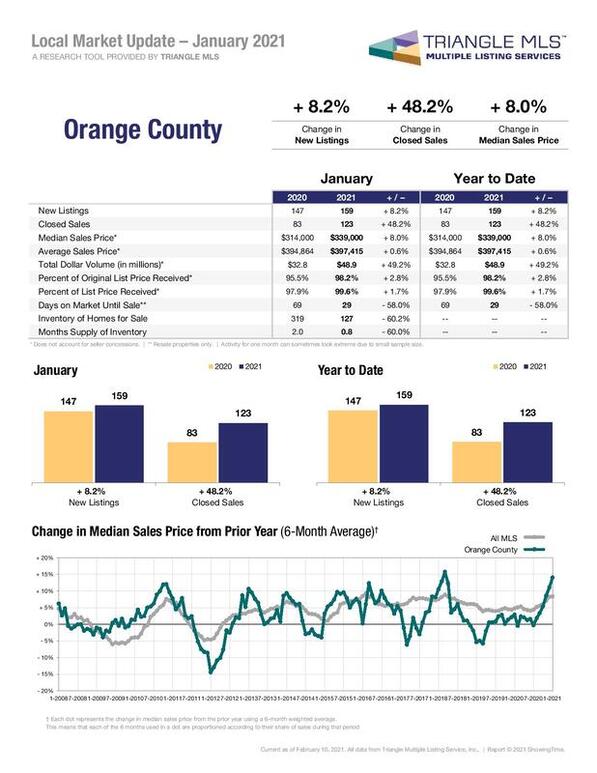 In Wake County, there was a decrease of 14.6 percent in the number of new listings, which decreased from 1,987 to 1,696. The number of closed sales increased 15.5 percent from 1,234 to 1,425. Median sales prices also increased by 8.1 percent for January. Compared to the median sales price for all MLS listings, Wake County median sales price were about level in January. 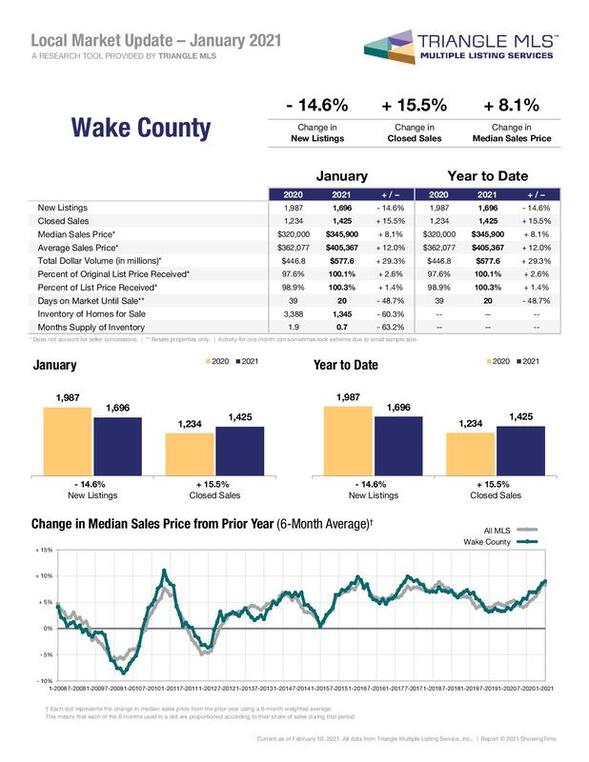 For more information on Carl's services for buyers and sellers, CLICK HERE.
0 Comments
Leave a Reply. |
Archives
July 2024
Categories
All
|
 RSS Feed